
The cryptocurrency market remains locked in a state of high-tension anticipation as XRP, the digital asset associated with Ripple, struggles to find its footing following a brutal selloff. For market participants and institutional investors, the current price action is more than just a routine fluctuation; it is a critical test of structural support. As XRP attempts to pivot from a period of intense bearish pressure to a sustained recovery, technical analysts are closely monitoring a potential three-part impulse structure that could signal the end of a long-term macro correction.
The Anatomy of the Current Correction
To understand the current volatility, one must look at the broader historical context of XRP’s price movement over the last eighteen months. The asset has been mired in a complex, multi-layered corrective sequence known in Elliott Wave theory as a "W-X-Y double zigzag." This structure has effectively consumed a significant portion of the price history since the asset last tested levels above the $3.00 threshold.
The "W" leg represented an initial ABC decline, finding a critical floor at the (C)/(W) pivot point in early February. This was followed by a "linking" wave X—a counter-trend rally that briefly injected optimism into the market by pushing XRP above the $1.50 mark in mid-May. However, this rally lacked the fundamental momentum to break through established overhead resistance, leading to a swift rollover. The subsequent "Y" leg has been the primary driver of the current bearish trend, dragging prices down toward the $1.10–$1.12 range.
Market observers, including prominent analysts on X (formerly Twitter), suggest that the current price action at $1.12 is the final stage of this "Y" leg. Should this level hold, the path of least resistance shifts from further downside to a significant, impulsive recovery.
Chronology: From Peak to Potential Pivot
The trajectory of XRP over the past year has been defined by three distinct phases that have dictated market sentiment:
- The Initial Decline (The W-Wave): Following the highs above $3.00, the market entered a cooling-off period. This phase was characterized by a classic ABC correction, which exhausted seller liquidity and established a macro support base in early February.
- The False Dawn (The X-Wave): The mid-May rally to $1.50 served as a classic "relief bounce." While it provided a glimmer of hope for bulls, the internal structure of this move—an (X)-(A)-(B) sequence—was inherently fragile. It failed to establish a higher high, setting the stage for the liquidity drain that followed.
- The Current Consolidation (The Y-Wave): Since the mid-May peak, XRP has been in a sustained decline. The current testing of the $1.05–$1.12 zone represents the finalization of this sequence. It is here that the "battle for the bottom" is taking place, with bulls attempting to force a breakout from the levels that were breached during the initial crash.
Supporting Technical Data: The Impulse Setup
The technical setup currently under observation hinges on a three-wave ABC recovery pattern. Analysts are projecting a roadmap that, if fulfilled, could see XRP reclaim its previous glory.
The Projected Path
The projected recovery is not a singular vertical move, but rather a calculated advancement:
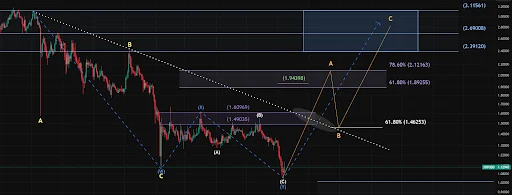
- Wave A: Expected to drive the price toward the $2.12 resistance level. This leg will likely face its first major hurdle at the $1.46 support/resistance flip level.
- Wave B: A tactical pullback to the $1.46 region. It is essential to note that this retracement should not be interpreted as a return to bearish sentiment, but rather as a necessary "shakeout" to consolidate gains before the final push.
- Wave C: The culmination of the sequence. This is anticipated to be the strongest move, targeting the upper resistance band between $2.70 and $3.11.
If the price succeeds in breaking through the $3.10 ceiling, it would fundamentally alter the narrative, suggesting that the $1.05 low was, in fact, the macro bottom. In this scenario, the three-part impulse acts as the foundation for a trend reversal toward new all-time highs.
The Downside Risk
Despite the optimism, the market remains cautious. Technical analysis dictates that momentum is the primary validator of any trend. Should XRP fail to break the $2.12 level or lose momentum after the initial rebound, the bearish outlook persists. In a worst-case scenario, the asset could be forced to revisit the $0.75 to $1.00 range. Many analysts have long flagged the $0.87–$0.92 zone as the "ultimate" bottom for a secondary corrective macro wave, should the current support level collapse.

Implications for Investors and the Market
The current situation presents a classic "high-conviction" moment for investors. The implications of this price action extend beyond mere technical chart reading:
Institutional Interest and Market Sentiment
Trading interest in XRP remains at record levels, suggesting that institutional players are watching these technical levels with the same intensity as retail traders. High trading volume during the test of the $1.10 support suggests that there is a significant "buy-side" interest defending this zone. For Ripple, a sustained move above the $2.00 mark would be a major psychological win, potentially attracting fresh capital that has been sidelined by the recent volatility.
The "Macro-Bottom" Narrative
The validity of the W-X-Y structure is currently the most debated topic among analysts. If the $1.05 level holds, the market will likely view this as the definitive end of the "post-crash" era for XRP. This would shift the focus from "surviving the bear market" to "initiating the next cycle." However, if the support is breached, it could trigger a "stop-loss cascade," forcing the price into the sub-$1.00 region, where the market would have to re-evaluate the asset’s value proposition entirely.
Expert Perspectives and Market Outlook
While technical charts provide the framework, the underlying market conditions are influenced by a broader array of factors. Analysts are increasingly looking at the interplay between Binance flow data and broader macroeconomic trends. Recent data has signaled a slight weakening in demand, which explains the difficulty XRP has faced in breaking through the $1.46 resistance level.
The prevailing view among experts is that XRP is in a "wait-and-see" phase. The asset is caught between the technical potential for a massive rally and the reality of current selling pressure. Most analysts suggest that until XRP can decisively clear the $1.50 level with sustained volume, the "impulse" remains a theoretical setup rather than a confirmed trend.
Conclusion: The Path Forward
XRP is currently standing at a crossroads. The technical setup—a three-part impulse from a potential macro bottom—is compelling and provides a clear map for traders. If the bulls can defend the $1.05–$1.12 support zone and successfully navigate the $1.46 resistance, the path to $3.00 and beyond becomes increasingly viable.
However, the volatility of the crypto markets means that nothing is guaranteed. Investors should remain cognizant of the potential for a deeper correction toward the $0.90 level if momentum stalls. As it stands, the coming weeks will be decisive. Whether XRP emerges as a leader in the next market cycle or requires a deeper retracement to build strength, the current price action confirms that the asset remains one of the most closely watched and debated instruments in the digital currency ecosystem.
Disclaimer: This article is for informational purposes only and does not constitute financial advice. Investors should conduct their own research and consult with a professional advisor before making any investment decisions.