

The second quarter of 2026 will likely be remembered by decentralized finance (DeFi) participants as a period of profound volatility and structural testing. Following a period of relative stability, the sector was rocked by a wave of uncertainty—often referred to in market parlance as FUD (Fear, Uncertainty, and Doubt)—that triggered a significant exodus of capital. As Total Value Locked (TVL) plummeted, observers were forced to reconcile with the fragility of a sector still maturing under the pressure of high-profile security failures and shifting macroeconomic sentiment. However, as the industry transitions into the third quarter, early signals suggest a rotation of capital that may redefine the landscape for the remainder of the year.
Main Facts: The Q2 Liquidity Crisis
The primary catalyst for the Q2 downturn was not merely a decline in asset valuations, but a series of high-impact protocol exploits that undermined investor confidence. These security breaches resulted in cumulative losses exceeding $600 million, a figure that acted as a shock to the system.
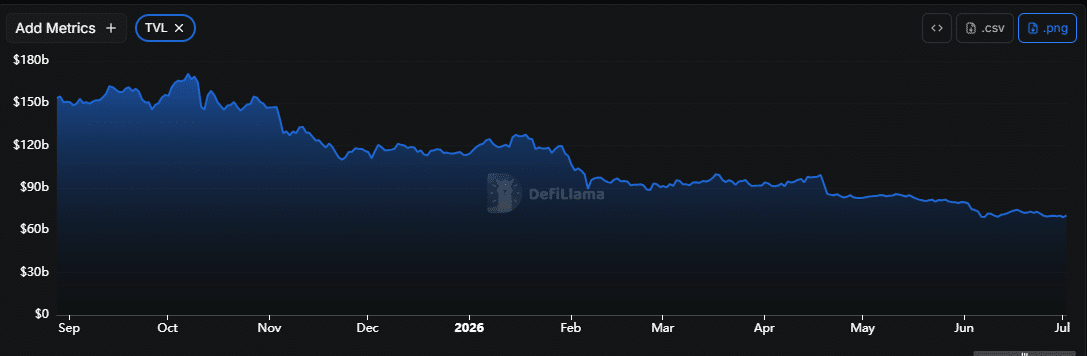
The scale of the drawdown was staggering. DeFi protocols witnessed an outflow of more than $20 billion in a single quarter. This brought the industry’s aggregate TVL down from its pre-October 2025 peak of approximately $150 billion to a precarious low of roughly $70 billion. This contraction represented the sharpest quarter-over-quarter decline in TVL since the turbulence of 2021. The speed at which users unstaked assets and reduced their exposure to decentralized protocols served as a stark reminder of the "risk-off" mentality that currently dominates the crypto-asset class.
Chronology of the Decline
The unraveling of the DeFi sector did not happen in a vacuum; it followed a specific, identifiable trajectory:
- Pre-Q2 2026: The market was riding the momentum of a late-2025 bull run, with TVL comfortably anchored around the $150 billion mark.
- Early Q2 2026: A series of targeted protocol exploits began to surface. These attacks exposed vulnerabilities in smart contracts, leading to immediate panic-selling and capital flight.
- The KelpDAO Inflection Point: The exploit of KelpDAO served as the most significant "black swan" event of the quarter. Within 24 hours of the news, Aave—the cornerstone of decentralized lending—saw its TVL plummet by 18%, shedding roughly $17.8 billion.
- Systemic Contagion: The fear generated by the Aave incident quickly spread across the ecosystem. Ethereum, as the primary hub for DeFi, bore the brunt of the impact, losing over $10 billion in TVL as users sought safety in stablecoins or migrated to off-chain environments.
- Mid-Q2 2026: The industry reached a nadir, characterized by extreme risk aversion and a stagnation in new project development as teams focused on security audits and emergency patches.
Supporting Data: Signs of a Shift
While the Q2 metrics were undeniably grim, the data emerging at the start of Q3 offers a more nuanced narrative. The market is showing the first tentative signs of a bottoming-out process.
A critical indicator of this shift is the recovery of network participation. Aave, which served as the bellwether for the decline, has recently recorded 1,806 new wallet addresses in a single 24-hour window. This represents the strongest network growth for the protocol since October 2021. While a single day of data is not sufficient to declare a full-scale reversal, it signals that the capitulation phase may have concluded and that interest in decentralized lending is being rekindled.
Furthermore, stablecoin liquidity is acting as the "canary in the coal mine." Data from major Layer-1 (L1) networks confirms a return of capital:
- Solana: Ended Q2 with a record $16.6 billion in stablecoin supply, suggesting that the ecosystem is becoming a preferred destination for liquidity.
- Stellar: Recorded a 32.6% increase in 30-day stablecoin transfer volume, highlighting increased utility and movement.
- Cardano: Has seen its native stablecoin supply grow by over 20% within the last week alone, according to DeFiLlama.
These inflows are not occurring in isolation. They are paired with a noticeable decline in Centralized Finance (CeFi) activity. CryptoQuant reports indicate that CeFi lending contracted by 6% quarter-over-quarter to $23.3 billion—marking the first such decline since Q3 2024. This suggests a classic rotation: as centralized entities face increased regulatory scrutiny and institutional fatigue, users are once again testing the waters of decentralized, on-chain alternatives.
Official Responses and Security Posture
The industry’s response to the Q2 exploits has been multifaceted. Leading protocols, including Aave, have accelerated the implementation of multi-signature governance and real-time security monitoring tools. Several decentralized autonomous organizations (DAOs) have held emergency votes to bolster their insurance funds, signaling a shift from a "move fast and break things" mentality to one of "security-first" development.
Market analysts from firms like CryptoQuant have emphasized that the $600 million loss was a necessary, albeit painful, stress test. By forcing protocols to upgrade their defensive infrastructure, the Q2 crisis may have actually improved the long-term viability of the DeFi ecosystem. The consensus among analysts is that the protocols that survive this cycle will emerge as "battle-tested" assets, making them more attractive to institutional investors who prioritize risk management over high-yield speculative mechanics.
Implications for the Q3 Outlook
The broader implication of these shifts is a potential maturation of the crypto-market. The transition of liquidity from CeFi back to DeFi suggests that the "risk-off" sentiment is fading.
1. The CeFi-to-DeFi Rotation
The contraction in CeFi lending is a pivotal development. It suggests that users are moving away from the black-box nature of centralized intermediaries and returning to the transparency of on-chain protocols. This rotation is historically a bullish signal for DeFi governance tokens, which often track the growth of TVL and protocol usage.
2. Market Bottoming
The increase in new wallet addresses and the growth in stablecoin supply across Solana, Stellar, and Cardano indicate that capital is waiting on the sidelines to be deployed. If the current growth rate of new users is sustained throughout July and August, we may see a significant rally in TVL, potentially pushing the industry back toward the $100 billion threshold.
3. Regulatory and Structural Resilience
The fallout from Q2 has undoubtedly caught the attention of regulators. However, the industry’s ability to absorb $600 million in losses without a total collapse of the underlying infrastructure is being viewed by some institutional observers as a demonstration of "anti-fragility." The push for standardized auditing and cross-protocol security sharing is expected to be a major theme for the remainder of 2026.
Conclusion: The Path Ahead
The second quarter of 2026 was a crucible for DeFi. It stripped away the excesses of the previous year and forced a reckoning with the fundamental risks inherent in decentralized finance. However, the data emerging from the start of Q3 paints a picture of a sector that is not only resilient but ready to capitalize on a fresh wave of liquidity.
As stablecoins move back on-chain and network participation metrics begin to trend upward, the narrative is shifting from survival to recovery. Whether this is the beginning of a sustained Q3 rally or a temporary respite remains to be seen. What is clear, however, is that the market is currently in a state of transition—one where investors are once again finding comfort in the transparency and accessibility of DeFi, provided that protocols can continue to demonstrate that they have learned the harsh lessons of the past quarter. Investors should monitor stablecoin supply growth and network activity as the primary indicators for the market’s trajectory in the coming months.
