

Executive Summary: The Current State of Solana
Solana (SOL), once the darling of the high-throughput blockchain sector, is currently navigating a precarious technical environment. Following a failed attempt to maintain a position above the $67 threshold, the asset has entered a corrective phase, mirroring broader market sentiments observed in major cryptocurrencies like Bitcoin and Ethereum. As of the latest trading sessions, SOL has slipped below critical support levels, forcing traders and institutional investors to recalibrate their expectations for the near term. This report provides an in-depth examination of the technical landscape, the factors driving the current price action, and the potential implications for Solana’s trajectory in the coming weeks.
Chronology of the Decline
The recent price movement of Solana can be categorized into a sequence of technical failures and subsequent bearish consolidation.
The Peak and Rejection
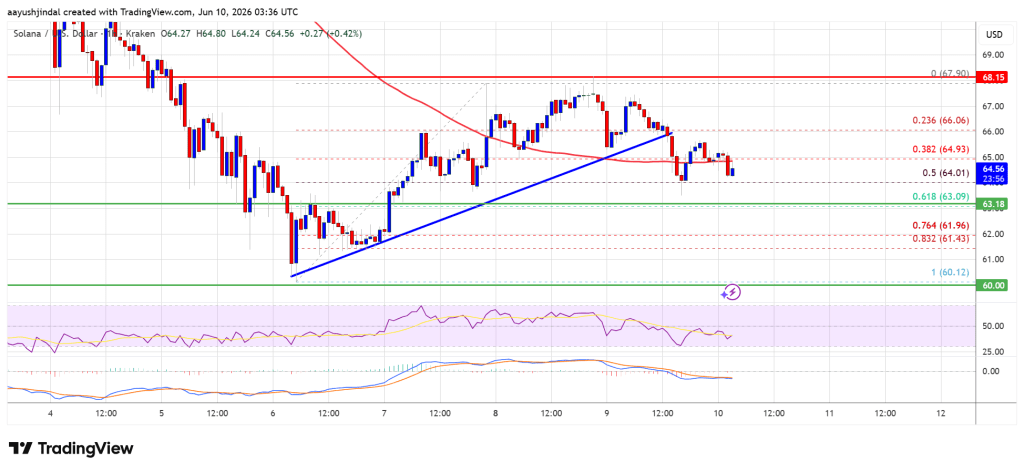
At the start of the week, Solana demonstrated signs of bullish momentum, climbing toward a swing high of $67.90. This upward wave, originating from a support base at $60.12, generated optimism among retail traders who anticipated a breakout toward the $70 psychological barrier. However, the momentum proved insufficient to sustain the rally.
The Breakdown
On the hourly charts, a clear structural failure emerged. The price of SOL failed to hold the $67 support level, triggering a series of sell-offs. The breach of a long-standing bullish trend line—which had served as a foundation for the asset—marked the first major sign of weakness. Subsequently, the price cascaded below the 50% Fibonacci retracement level of the move from $60.12 to $67.90.
Current Status
As of the latest data, SOL is struggling to reclaim lost ground. It is currently trading below the $65 mark and has fallen beneath its 100-hour simple moving average (SMA). This transition indicates that the short-term trend has shifted from bullish to bearish, with the market now testing support zones near the $63 level.

Technical Analysis and Supporting Data
Understanding the current movement requires a deep dive into the quantitative indicators that define market sentiment.
Fibonacci Retracement Levels
The Fibonacci tool, a staple for technical traders, highlights the intensity of the current correction. The price has already dipped past the 50% retracement level. The next critical juncture is the 61.8% Fibonacci level, which aligns closely with the $63.10 support zone. Should this level fail to provide a "bounce," the technical outlook suggests that the asset could move toward $62.20, effectively invalidating the gains achieved earlier in the month.
MACD and RSI Indicators
The momentum indicators paint a stark picture:
- Hourly MACD (Moving Average Convergence Divergence): The MACD line for the SOL/USD pair is currently gaining pace within the bearish zone. The divergence between the MACD and the signal line indicates that selling pressure is increasing rather than abating.
- Hourly RSI (Relative Strength Index): The RSI is currently situated below the 50 level. This is a critical indicator of sentiment; a reading below 50 suggests that the bears are in control and that the asset is not yet "oversold" enough to entice a significant influx of bargain hunters.
Resistance and Support Mapping
For market participants looking to navigate this volatility, the following levels are paramount:
- Immediate Resistance: $65.00 and $66.00.
- Major Resistance: $67.20. A successful daily close above this level is required to nullify the current bearish structure.
- Initial Support: $63.10 and $62.20.
- Critical Support: $60.00. If this level is breached, a rapid descent toward $55 could materialize, as historical volume profiles show thin support between $55 and $60.
Institutional and Ecosystem Implications
While technical analysis provides the "what," understanding the ecosystem provides the "why." Solana’s price action is inextricably linked to the broader health of its ecosystem, including decentralized finance (DeFi) activity and NFT volume.

The Correlation Factor
Solana has historically shown a high beta correlation with Bitcoin. When Bitcoin stumbles near the $64,000 mark—as it has recently—Solana tends to experience magnified volatility. The current "slip" is not isolated to SOL; rather, it is a reflection of a risk-off environment across the crypto-asset class. Investors are currently exercising caution, likely waiting for clearer macroeconomic signals or institutional buying pressure to re-enter the market.
Ecosystem Resilience
Despite the price dip, the fundamentals of the Solana blockchain remain robust. High transaction throughput and low latency continue to attract developers. However, market prices often decouple from developer activity in the short term. The challenge for SOL is to maintain its "chain-utility" value while the speculative trading market undergoes a necessary deleveraging process.
Expert Commentary: Navigating Volatility
Market experts suggest that the current price action should be viewed as a period of consolidation. According to senior market analyst Aayush Jindal, who has over 15 years of experience in Forex and crypto trading, the ability to discern patterns is what separates successful investors from the rest.
"In a landscape where uncertainty reigns supreme," says Jindal, "the goal is not to predict the exact bottom, but to identify the key support and resistance levels that dictate market sentiment." His approach emphasizes that while technical indicators like the RSI and MACD are flashing warnings, they are also tools to identify entry points for long-term holders once the volatility subsides.
Future Outlook: Scenarios for the Coming Weeks
What lies ahead for Solana? Based on the current trajectory, there are two primary scenarios:
The Bullish Rebound Scenario
If SOL can consolidate above the $63 support and successfully push past the $66 resistance, it may trigger a short-covering rally. A breakout above $67.20 would likely bring the $68 level into play, with a potential target of $70. This would require a broader market recovery, particularly from Bitcoin, to act as a catalyst.
The Bearish Continuation Scenario
If the $63.10 support fails to hold, the market will likely test $62.20. A break below this would be a significant technical blow, potentially shifting the sentiment toward a longer-term bearish trend. Should the price close below $60, the market may see a "liquidity flush," where stop-losses are triggered, leading to a temporary drop toward the $55 range.
Conclusion
Solana stands at a crossroads. While the technical indicators currently lean toward a bearish short-term outlook, the asset’s underlying architecture and developer community remain strong. Investors are advised to monitor the $63 and $66 levels closely.
As always, the digital asset market remains highly unpredictable. While technical analysis provides a framework for understanding potential movements, it is not a crystal ball. Investors should conduct their own due diligence, assess their risk tolerance, and remain cognizant of the broader macroeconomic factors—such as interest rate changes and regulatory updates—that can influence price action overnight.
Disclaimer: The information contained in this report is provided for educational and informational purposes only. It does not constitute financial, investment, or trading advice. Trading cryptocurrencies involves substantial risk of loss and is not suitable for every investor. The content herein does not reflect the opinions of the publisher on whether to buy, sell, or hold any specific assets. Always conduct your own thorough research and consult with a qualified financial advisor before making any investment decisions. Use the information provided at your own risk.
