

The cryptocurrency market is currently witnessing a high-stakes standoff involving XRP, the digital asset native to the XRP Ledger. Following a brutal, extended selloff that left many investors questioning the asset’s short-term viability, XRP bulls are now mounting a significant effort to transform what began as a mere relief bounce into a full-scale trend reversal. Technical indicators suggest that the asset is currently at a pivotal juncture, with a potential three-part impulsive structure forming from the recent lows near the $1.05 to $1.07 range. However, the path to recovery remains fraught with technical hurdles, as buyers must demonstrate the strength to reclaim key price levels that were decimated during the recent market crash.
The Anatomy of the Correction: A Macro Perspective
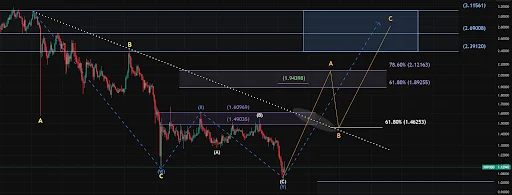
To understand the current setup, one must first analyze the historical context of XRP’s price action over the past year. Since peaking above the $3.00 threshold, XRP has been trapped in a protracted corrective sequence. Market observers, including prominent analysts on social media platform X (formerly Twitter), have identified this downward trajectory as a "W-X-Y" double zigzag—a complex corrective pattern that has effectively consumed months of price history.
The sequence began with "Wave W," which traced a full ABC decline, ultimately finding a major floor near the (C)/(W) level in early February. This was followed by a "linking Wave X," a counter-rally that briefly propelled XRP above the $1.50 mark in mid-May. This rally, characterized by its own internal (X)-(A)-(B) sequence, ultimately failed to sustain momentum, leading to a significant rollover. This secondary rejection initiated the final "Y leg," which has kept the asset under downward pressure, pushing it toward the $1.12 range.
This structural analysis is critical for investors, as it suggests that the current price action is not random volatility but rather the concluding phase of a long-term corrective cycle. If the (C)/(Y) wave currently playing out at the $1.12 level successfully establishes a bottom, it would set the stage for a dramatic transition from a corrective phase into a powerful, bullish impulse wave.
The Three-Part Impulse Setup: Charting the Path to $3.00
With the market eyeing the $1.12 support level, technical analysts are pointing toward a prospective three-wave "ABC" recovery structure. This model projects a clear roadmap for XRP to return to the upper resistance band between $2.39 and $3.11.
Phase 1: The Initial Impulse (Wave A)
The first phase, or Wave A, is expected to drive price action toward the $2.12 level. This move would serve as the initial confirmation that the bearish momentum has been exhausted. However, this ascent is not expected to be linear. Analysts highlight a critical support-turned-resistance trendline at $1.46, which represents the first major obstacle for bulls. Successfully breaking through this barrier is essential to validate the broader recovery thesis.
Phase 2: The Tactical Pullback (Wave B)
Following the push toward $2.12, the model suggests a retracement—Wave B—which would likely see the price settle back toward the $1.46 zone. Crucially, investors are advised to view this pullback not as a sign of renewed weakness, but as a "shakeout" phase designed to consolidate gains before the final leg. Managing expectations during this phase is vital, as volatility is expected to remain elevated.
Phase 3: The Final Surge (Wave C)
The final and most powerful leg of the sequence is Wave C. Projections place the target for this move firmly in the $2.70 to $3.10 range. A decisive break above the $3.10 resistance level would be a monumental event for the asset, signaling that the macro bottom established at $1.05 is firm and that the market has transitioned into a long-term bullish reversal. Such a move would effectively erase the losses incurred during the previous year and potentially pave the way for a test of new all-time highs.
Supporting Data and Market Sentiment
The technical structure is supported by a growing sentiment shift among institutional and retail traders. Recent data indicates a surge in "trading interest," suggesting that market participants are actively seeking entry points at these lower valuations. The transition from fear to accumulation is a classic hallmark of bottoming processes in cryptocurrency cycles.
Furthermore, the "macro bottom" hypothesis is bolstered by the alignment of various technical indicators. The fact that multiple analysts have converged on the $0.87 to $0.92 region as a potential "safety net" should the current support fail adds a layer of risk management to the current trade. Even if the immediate impulse fails to materialize, the structural consensus remains that the asset is approaching a valuation zone that offers significant long-term risk-reward potential.
Risks: The "Bearish Scenario" and Potential Downsides
While the impulse setup provides a compelling bullish narrative, it is imperative to acknowledge the risks of failure. Financial markets are rarely dictated by theory alone, and should XRP lose momentum after the projected initial rebound, the consequences could be severe.
If the $1.46 resistance level proves insurmountable, or if the price fails to hold the current $1.12 support, the market could shift focus toward completing a deeper "macro wave 2." In this scenario, analysts have identified the $0.75 to $1.00 range as a critical secondary support area. Should the price slide into this zone, it would likely invalidate the current three-part impulse structure and force a re-evaluation of the long-term cycle.
Market participants should remain vigilant regarding:
- Liquidity Flows: Monitoring Binance and other major exchange flows to detect weakening demand.
- Macroeconomic Triggers: External market forces, such as interest rate decisions and regulatory developments, which historically exert significant pressure on altcoins.
- Volume Profiles: A surge in buying volume on the upside is necessary to confirm the validity of the breakout above $1.46.
Implications for the XRP Ecosystem
The potential for a trend reversal has significant implications for the broader XRP ecosystem. XRP has long been a subject of intense regulatory scrutiny and market debate, yet its utility in cross-border payments remains a cornerstone of its value proposition. A move back to the $3.00 level would not only restore investor confidence but would also likely incentivize further institutional adoption of the XRP Ledger for financial services.
For the retail investor, the current volatility represents a test of patience and conviction. The technical patterns observed—specifically the W-X-Y correction—suggest that we are in the "final innings" of a multi-month consolidation. While the path to $3.00 is fraught with technical hurdles, the clarity of the current setup provides a roadmap that, if followed, could yield substantial returns.
Conclusion: The Path Ahead
XRP stands at a critical juncture. The bullish impulse structure forming from the $1.05 low provides a clear, data-driven narrative for a potential move toward $3.00 and beyond. However, the market remains in a "show me" phase. Investors are cautioned that technical analysis is a framework, not a prophecy. The next few weeks of trading will be instrumental in determining whether XRP can reclaim its former glory or whether it requires further, deeper consolidation before the next bull market cycle begins.
As always, market participants are encouraged to exercise prudent risk management. While the technical setup points toward a brighter horizon, the volatility inherent in digital assets mandates a disciplined approach, focusing on key support levels and volume confirmation as the price navigates these turbulent waters. The "three-part impulse" is a promising blueprint, but the ultimate direction will be decided by the collective actions of buyers and sellers in the days to come.
