

Main Facts
The cryptocurrency ecosystem is experiencing a robust influx of liquidity, driven by a continuous expansion in the aggregate market capitalization of stablecoins. This upward trajectory is evident across both multi-chain deployment architectures and individual stablecoin issuers, pointing toward heightened user engagement and preparation for broader market maneuvers.
Data compiled from various analytics platforms highlights TRON’s enduring dominance as the primary execution layer for digital dollars—specifically Tether (USDT)—accounting for nearly half of all deployed volume globally. Concurrently, decentralized exchange (DEX) volumes involving stablecoins have reached notable daily highs, signaling that capital is not merely sitting idle in wallets; rather, it is actively moving through decentralized finance (DeFi) rails.
Despite the aggressive minting and issuance of new stablecoins by prominent entities—including United Stables, Paxos, and Anchorage Digital—the overall market dominance of stablecoins is paradoxically declining. This contraction in dominance metrics correlates directly with an expanding broader cryptocurrency market capitalization. As total valuations climb past $2.19 trillion, analysts note that the influx of stablecoins is being rapidly converted into volatile, high-beta crypto assets like Bitcoin (BTC), Ethereum (ETH), Solana (SOL), and XRP (XRP).
While market sentiment remains cautious—hovering in a state of general fear rather than unbridled greed—the structural increase in liquidity lays a foundational bedrock that could dictate price action through the remainder of the quarter.
Chronology
Early July to Early August: The Seed of Recovery
The shifting dynamics of the digital asset market became apparent in early July, marked by a subtle yet decisive transition in macro liquidity flows. During this period, the total cryptocurrency market capitalization began a gradual recovery phase, lifting itself from local lows to steadily challenge higher resistance zones.

As market participants began to reassess their risk exposures, the total dominance of stablecoins—which had previously served as a safe haven during periods of acute volatility—began a steady descent. Total stablecoin dominance slipped from 14.79% downward toward 14.10%, breaking below a crucial sloping technical resistance line on TradingView charts. Tether’s (USDT) specific market share similarly retreated, landing at 8.445% as capital actively sought out yield and directional exposure in alternative crypto assets.
The Past Week: Accelerated Minting and Chain-Specific Growth
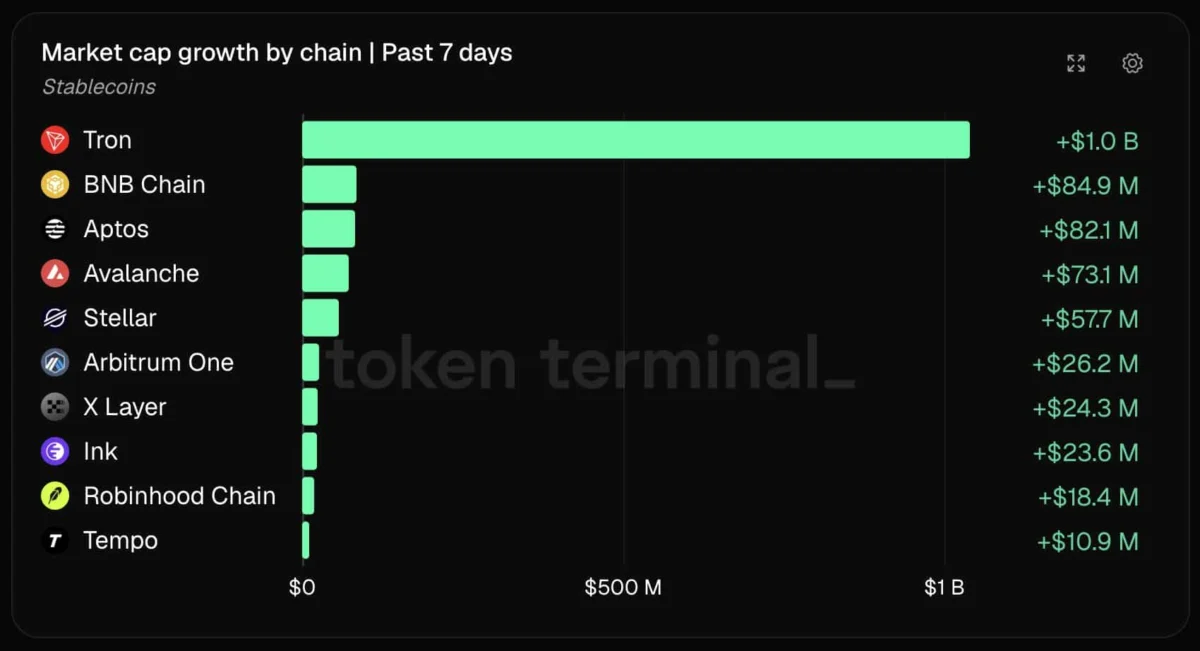
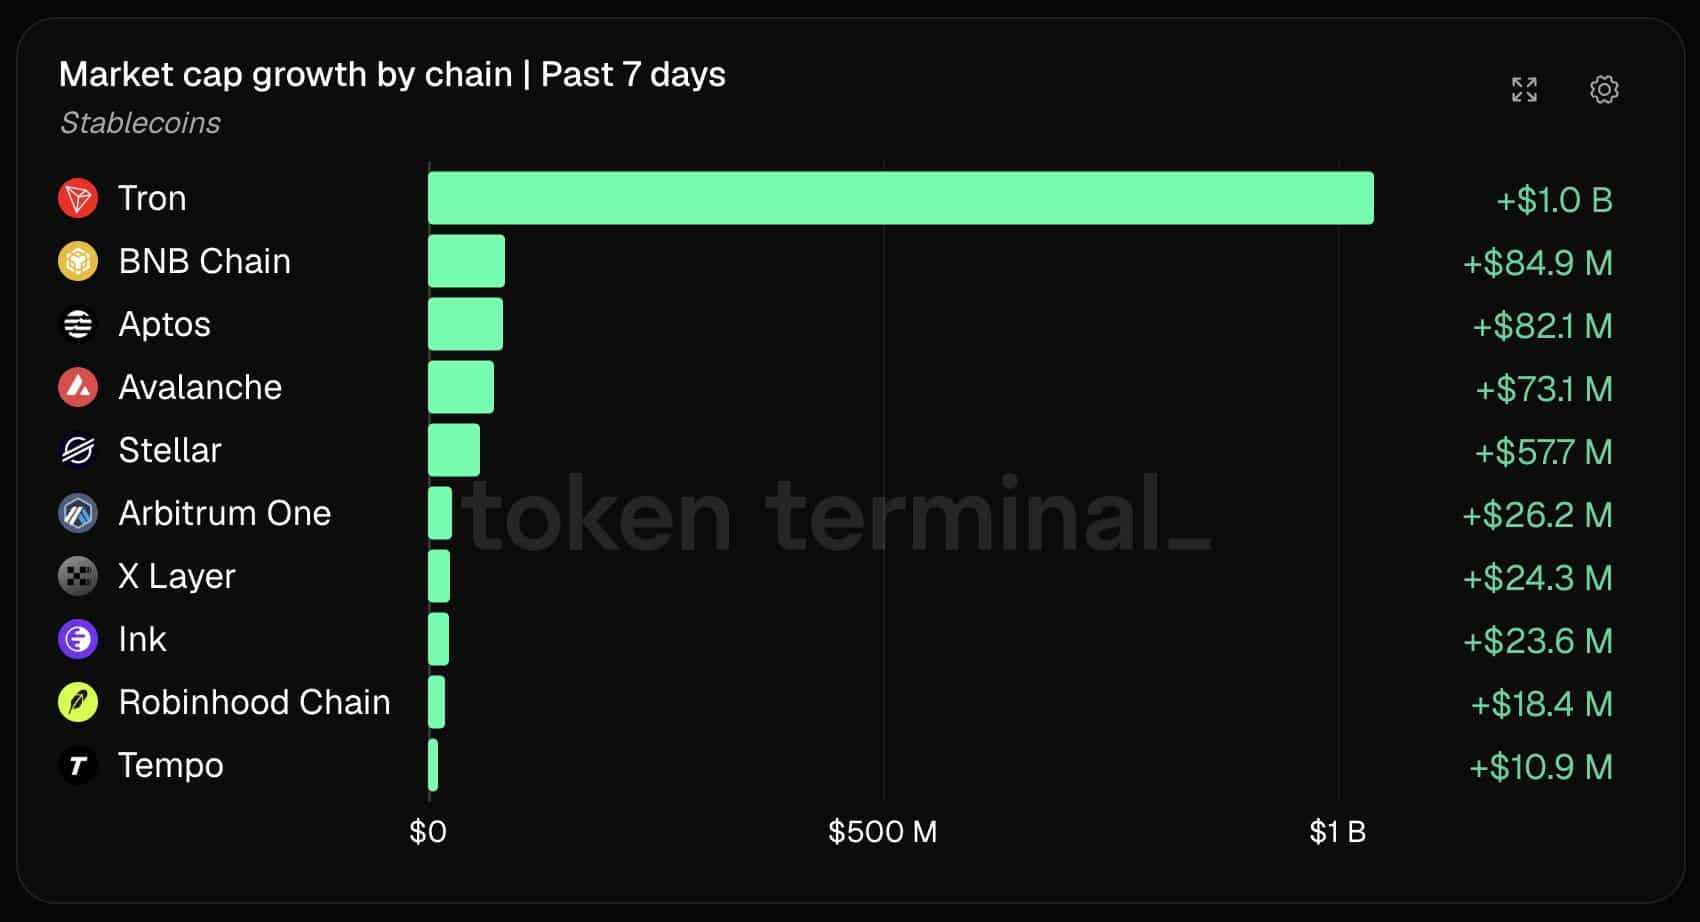
Over the seven days preceding mid-August, the velocity of stablecoin expansion accelerated noticeably. According to on-chain analytics provided by Token Terminal, the TRON network alone absorbed an additional $1 billion in stablecoin market capitalization within this single week. This figure dwarfed the growth rates recorded by competing layer-1 and layer-2 protocols by an order of magnitude exceeding tenfold.
Following TRON, alternative networks experienced healthy, albeit comparatively modest, capital inflows. The BNB Chain secured $85 million in new stablecoin liquidity, closely followed by Aptos (APT) at $82 million and Avalanche (AVAX) at $73 million. Lesser, yet strategically significant, contributions were also logged across Stellar Lumens (XLM), Arbitrum One (ARB), and the specialized Robinhood Chain.
August 10: The DEX Volume Peak
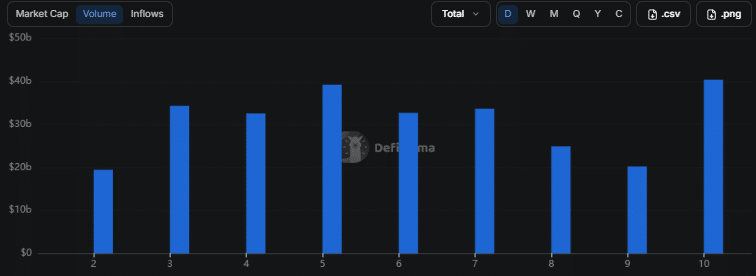
The heightened activity culminated on August 10, when daily stablecoin volume across decentralized exchanges hit a formidable daily peak of $40.37 billion, according to metrics tracked by DeFiLlama. This spike underscored an unprecedented acceleration in on-chain velocity.
Platform-specific milestones were achieved concurrently; notably, the Robinhood Chain recorded its single-day peak in stablecoin DEX volume on August 10, logging $366 million in transactions. Of this total, Ethereum-stablecoin trading pairs accounted for $193.2 million—representing well over half of the platform’s aggregate daily throughput and highlighting a concentrated burst of cross-asset positioning.
Supporting Data
To contextualize the current liquidity environment, a granular examination of on-chain metrics, network distributions, and issuer data reveals a diverse yet centralized web of stablecoin utilization:
Network Distribution and Growth Metrics
- TRON Network Lead: TRON maintains an ironclad grip on stablecoin execution, holding 49.35% of all USDT deployed across public blockchains.
- Weekly Capital Inflows (Token Terminal Data):
- TRON: +$1,000,000,000 ($1 billion)
- BNB Chain: +$85,000,000
- Aptos (APT): +$82,000,000
- Avalanche (AVAX): +$73,000,000
- XRP Ledger (Ripple): +$23,400,000
- Additional contributors included Stellar Lumens [XLM], Arbitrum One [ARB], and Robinhood Chain.
Issuer Performance Rankings
Stablecoin issuers have responded aggressively to incoming demand by minting fresh supply. Over the evaluated weekly window, the top five issuers by market cap growth were led by:
- United Stables: +$106 million
- Paxos
- Anchorage Digital
- Aave Protocol (AAVE)
- Ethena (ENA) / World Liberty Financial (WLFI)
Trading Volumes and Asset Rotation
- Global DEX Peak: Reached $40.37 billion on August 10.
- Robinhood Chain Peak: Hit $366 million on August 10, with ETH-stablecoin pairs contributing $193.2 million.
- Capital Rotation Threshold: Over 50% of Robinhood’s daily stablecoin DEX volume consisted of direct exchanges into major capitalization assets, confirming that traders are actively swapping fixed-value tokens for volatile positions in Bitcoin, Ethereum, Solana, and XRP.
Macro Market Valuations and Dominance Shifts
- Total Crypto Market Capitalization: Expanded from $2.15 trillion to $2.19 trillion, adding upwards of $40 billion in August alone.
- Stablecoin Dominance: Dropped from a high of 14.79% in early July to 14.10% by mid-August.
- USDT Dominance: Contracted to 8.445%.
- Market Sentiment Index: While improved compared to the prior month’s readings of "extreme fear," overall market sentiment remains anchored within a cautious "fear" classification.
Official Responses & Industry Commentary
While individual retail traders drive much of the decentralized exchange volume, institutional infrastructure providers, network developers, and protocol governance bodies have offered implicit commentary through their operational metrics and expanding product suites.
Representatives from major analytics providers, including Token Terminal and DeFiLlama, have emphasized that the rapid minting of digital dollars by issuers like Paxos and Anchorage Digital acts as a reliable forward-looking indicator of market health. In various technical briefings shared via social channels such as X (formerly Twitter), data analysts pointed out that sustained stablecoin creation—even during periods of subdued retail euphoria—reflects institutional positioning and over-the-counter (OTC) preparation for impending market volatility.
Furthermore, the integration of specialized environments like the Robinhood Chain and World Liberty Financial into the top tier of stablecoin growth metrics demonstrates a concerted industry push toward onboarding traditional retail capital into high-performance execution layers. Although executive commentary from these individual platforms has remained focused on feature rollouts and user experience enhancements, their underlying network statistics validate a systemic shift: liquidity is actively seeking out cross-chain utility rather than remaining siloed on legacy networks like Ethereum mainnet.
Implications
The convergence of rising stablecoin market capitalization, expanding DEX trading volumes, and declining stablecoin dominance carries profound implications for the trajectory of the broader cryptocurrency market.
1. De-risking vs. Risk-On Transitions
The traditional financial paradigm dictates that rising stablecoin supplies represent capital fleeing into safety, awaiting a market crash. However, within the crypto economy, the simultaneous expansion of total market capitalization ($2.19 trillion) and the decline in stablecoin dominance tell a different story. When stablecoin dominance drops alongside rising asset prices, it signals that sidelined capital is actively being deployed back into the market. Traders are utilizing minted stablecoins to acquire spot positions in major tokens, indicating a tentative return of a risk-on appetite.
2. Fragmentation vs. Consolidation of Liquidity Layers
TRON’s commanding lead—holding nearly 50% of all USDT—highlights a persistent structural reality: users continue to favor low-fee, high-speed execution environments for day-to-day transactional activity and cross-border value transfer, despite the proliferation of advanced layer-2 rollup networks. At the same time, the impressive weekly gains seen on alternative chains like Aptos, Avalanche, and the BNB Chain demonstrate that liquidity is not entirely monolithic. Multi-chain diversification is maturing, giving rise to specialized regional and application-specific liquidity hubs.
3. Sentiment Lag and Volatility Outlook
It is crucial to note that an abundance of liquidity does not automatically translate into an immediate bull market. Current sentiment indicators reflecting persistent "fear" suggest that market participants remain traumatized by prior drawdowns and macro uncertainty. However, historical precedent shows that bull markets are quietly built during periods of lingering skepticism, precisely when dry powder (stablecoins) is accumulating at record paces.
If stablecoin minting continues at its current velocity and DEX volume sustains its multi-billion-dollar daily baseline, the compressed energy within the market is likely to resolve in explosive directional volatility. Whether that volatility breaks upward to validate the ongoing $40 billion monthly market cap recovery or stalls against persistent macroeconomic resistance will depend entirely on how aggressively market participants deploy their newly minted capital in the weeks ahead.
